
Cenilko
A property price map for Slovenia, built on the official registers. Every recorded sale and rental since 2007, a value estimate from comparable deals, and the full file on a parcel before you buy, rent or invest.
Drag through the app
Know a place before you commit
Slovenia's public property records, turned into one clear map. Every deal sits where it happened, coloured by price. The database downloads once and the analysis then runs on your device.
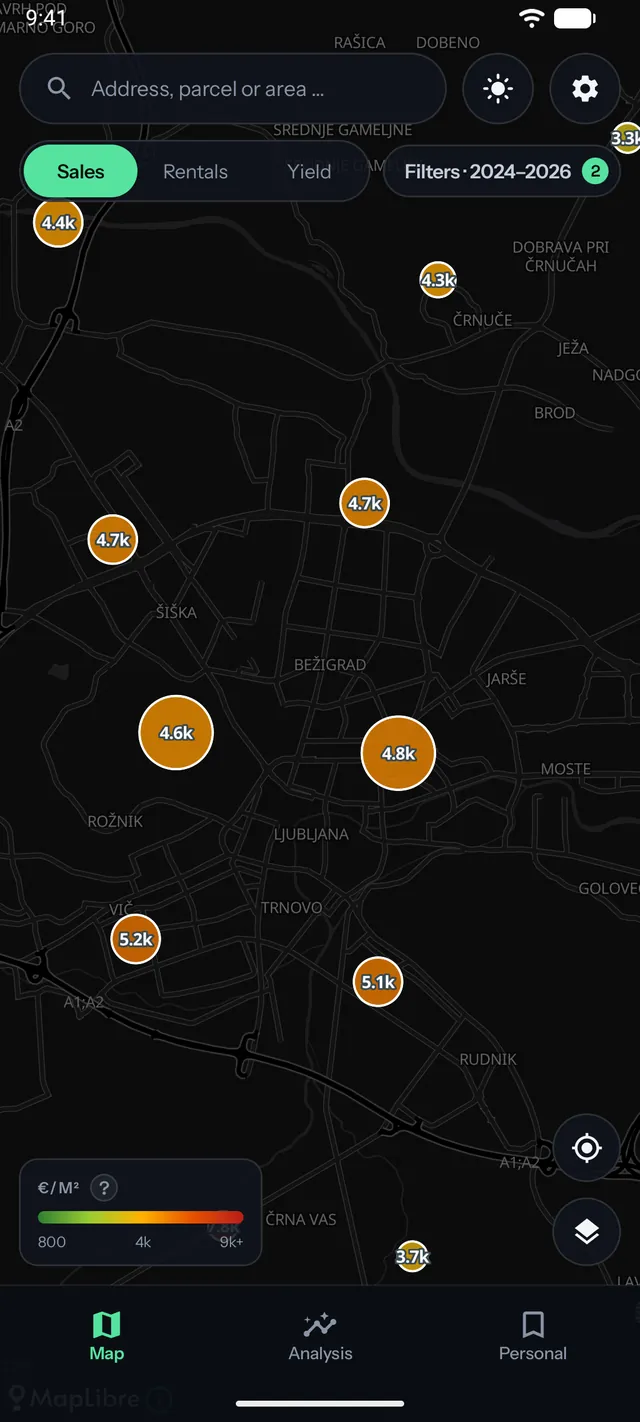
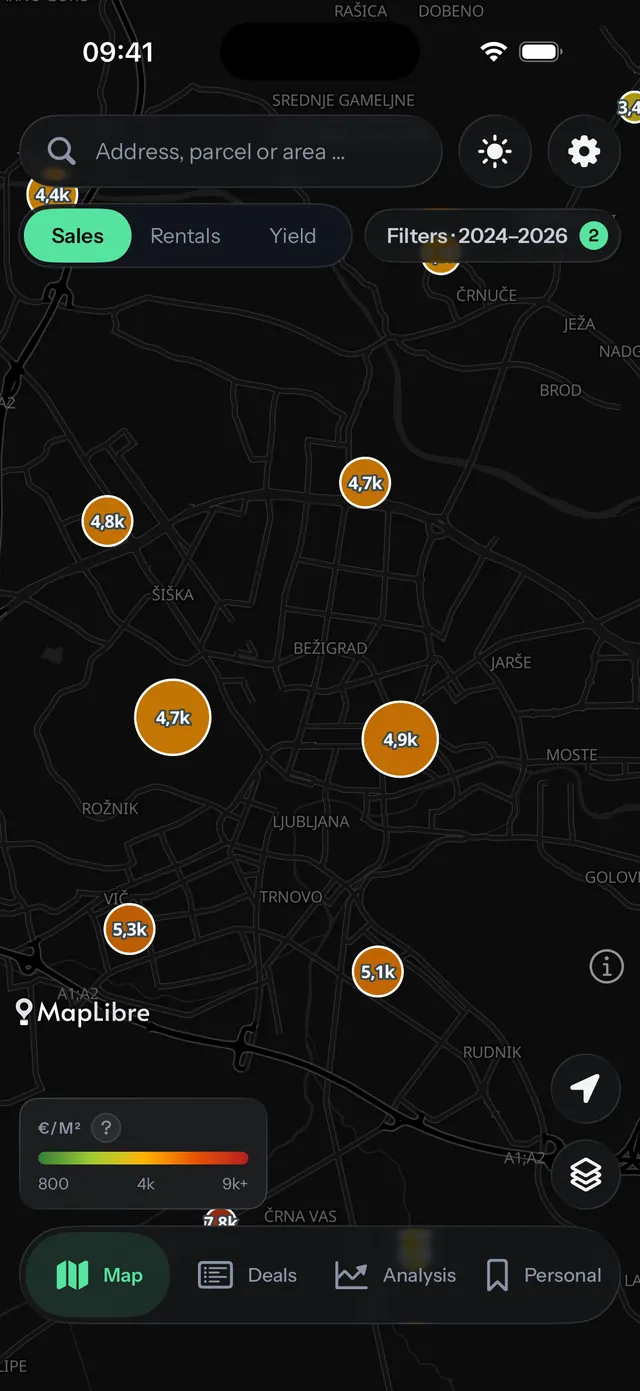
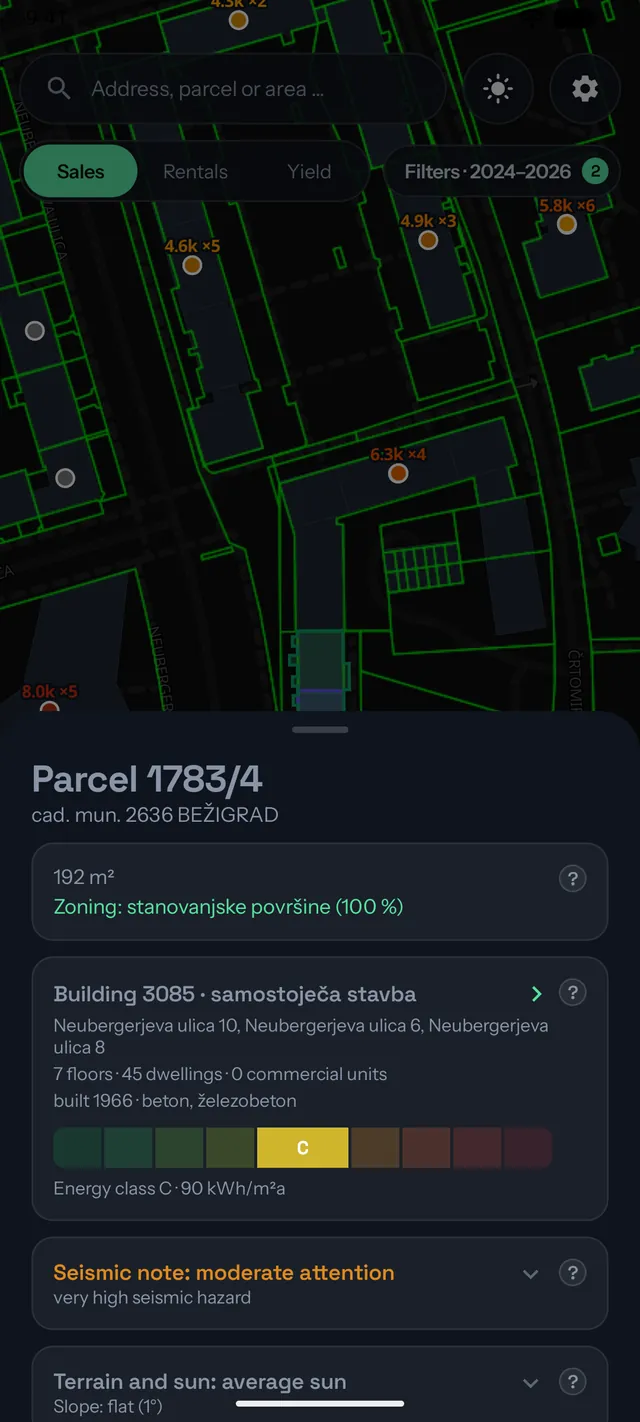
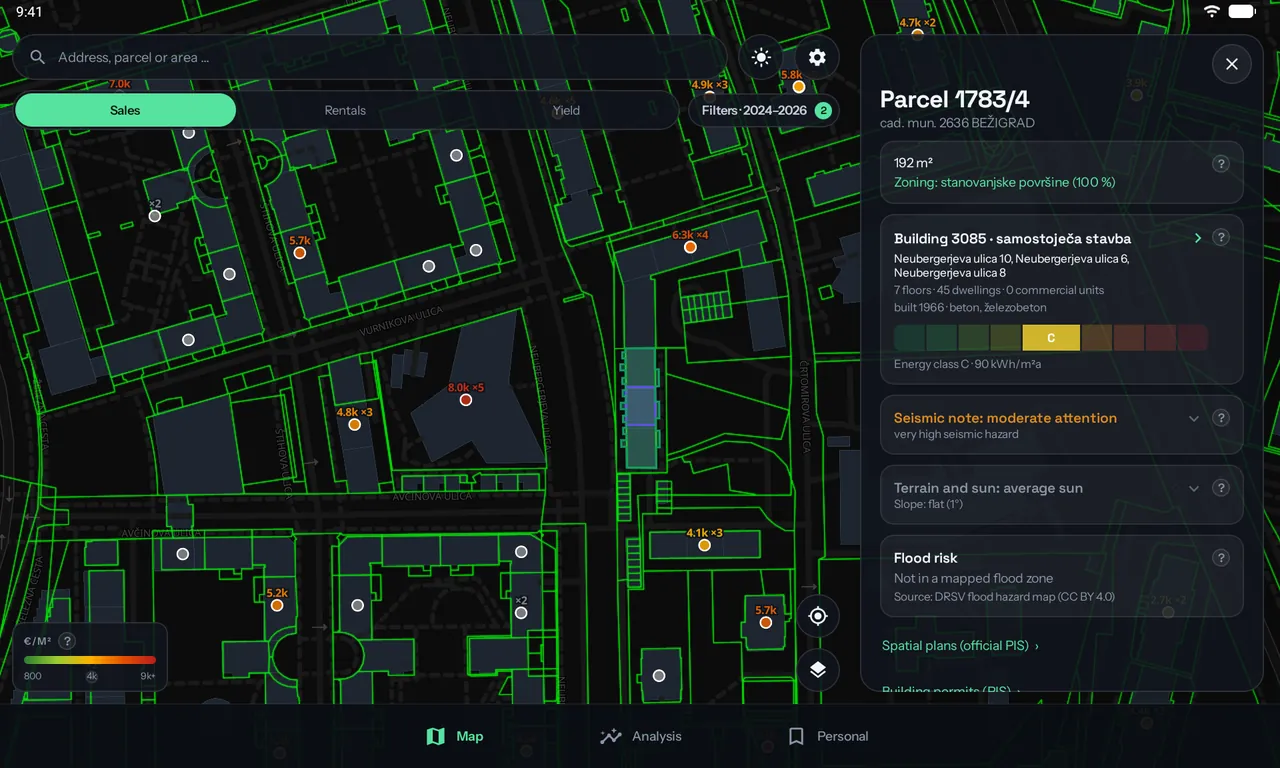
A price map of every deal
Recorded sales and rentals since 2007, coloured by euro per square metre and filtered by year and property type.
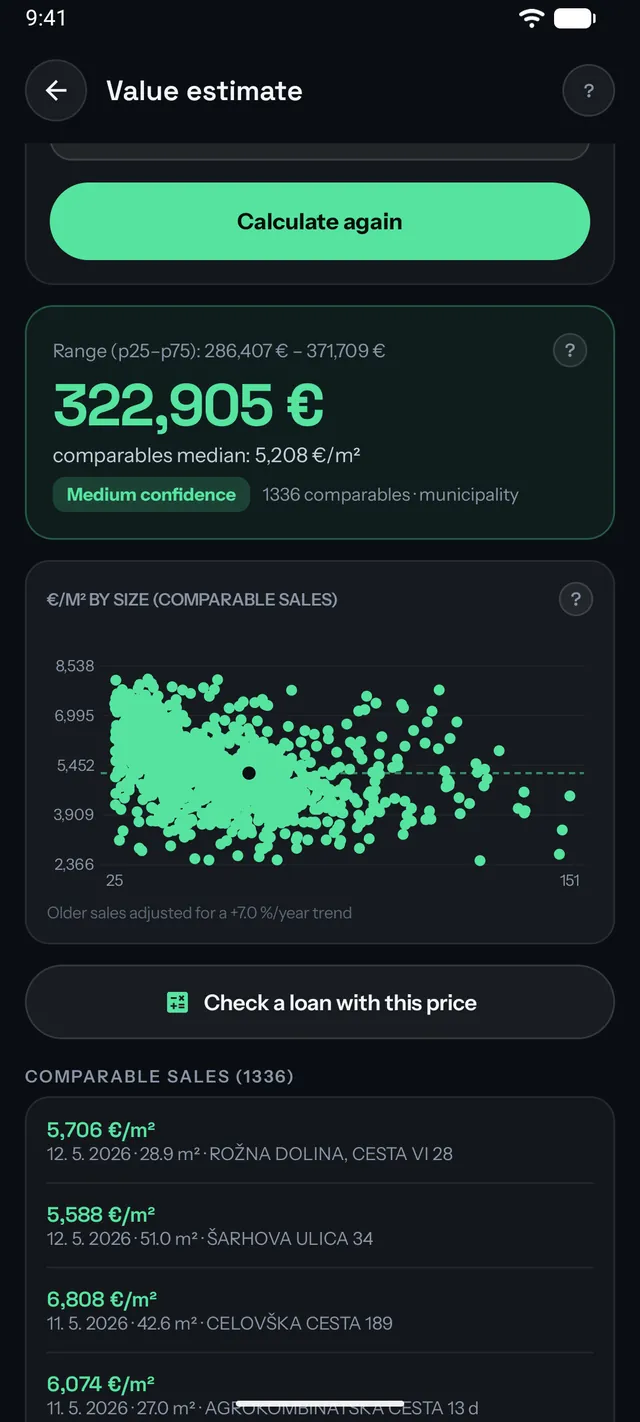
Value from comparable sales
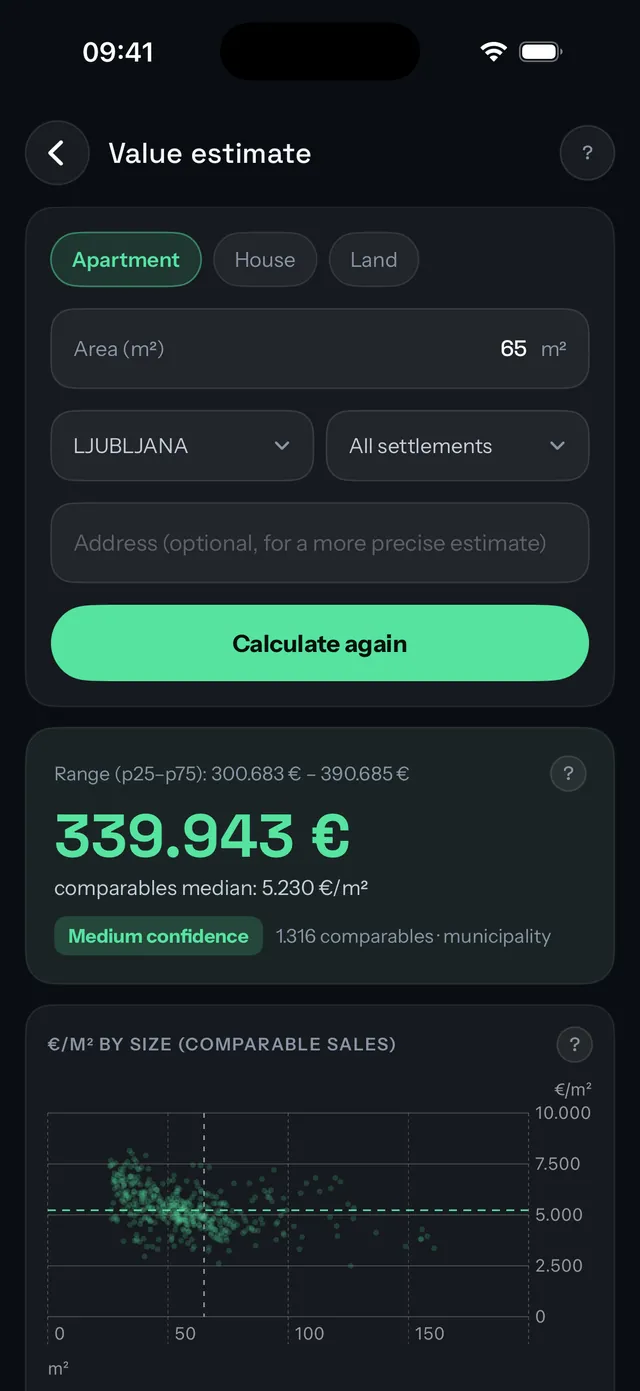
Enter a size and area and get an estimate with a price range, a confidence level and every comparable deal behind it, not a black box.
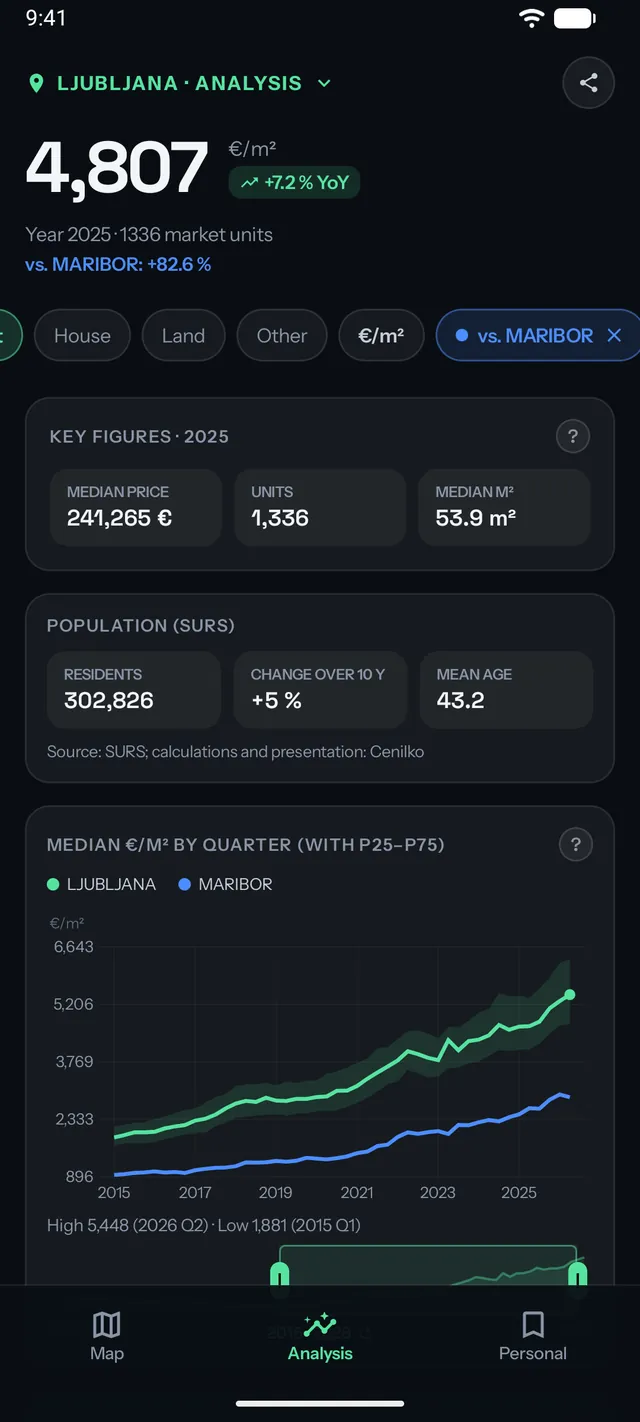
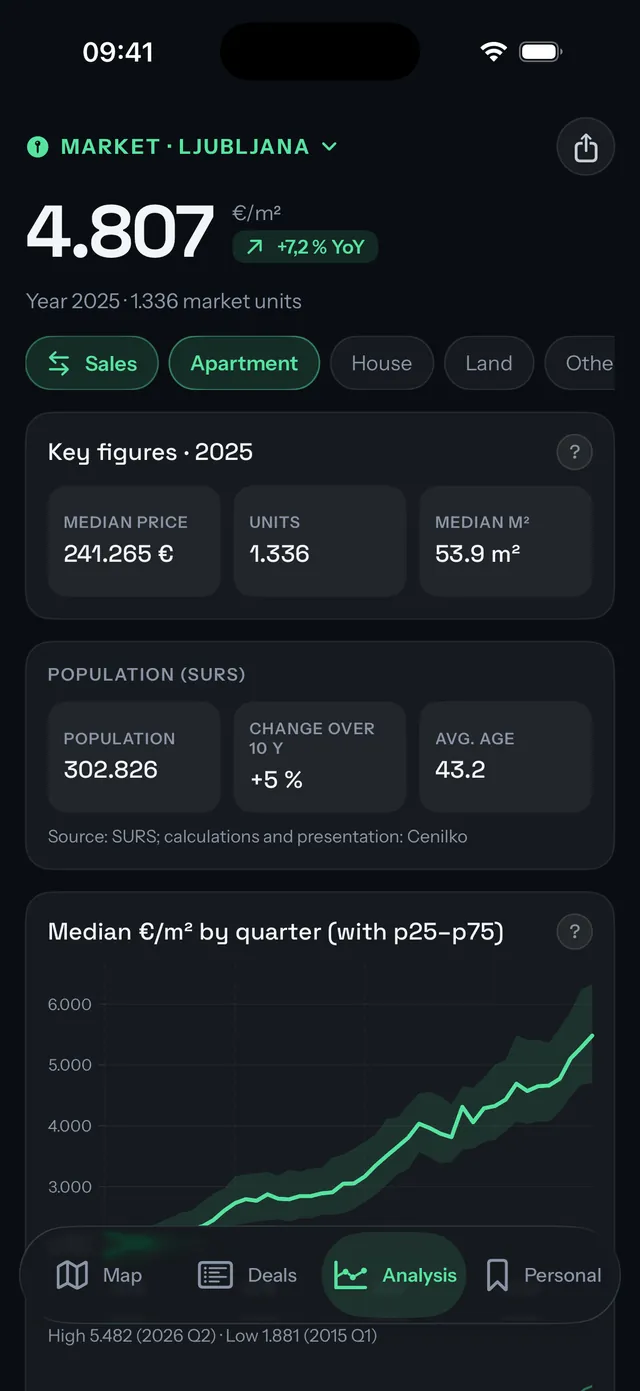
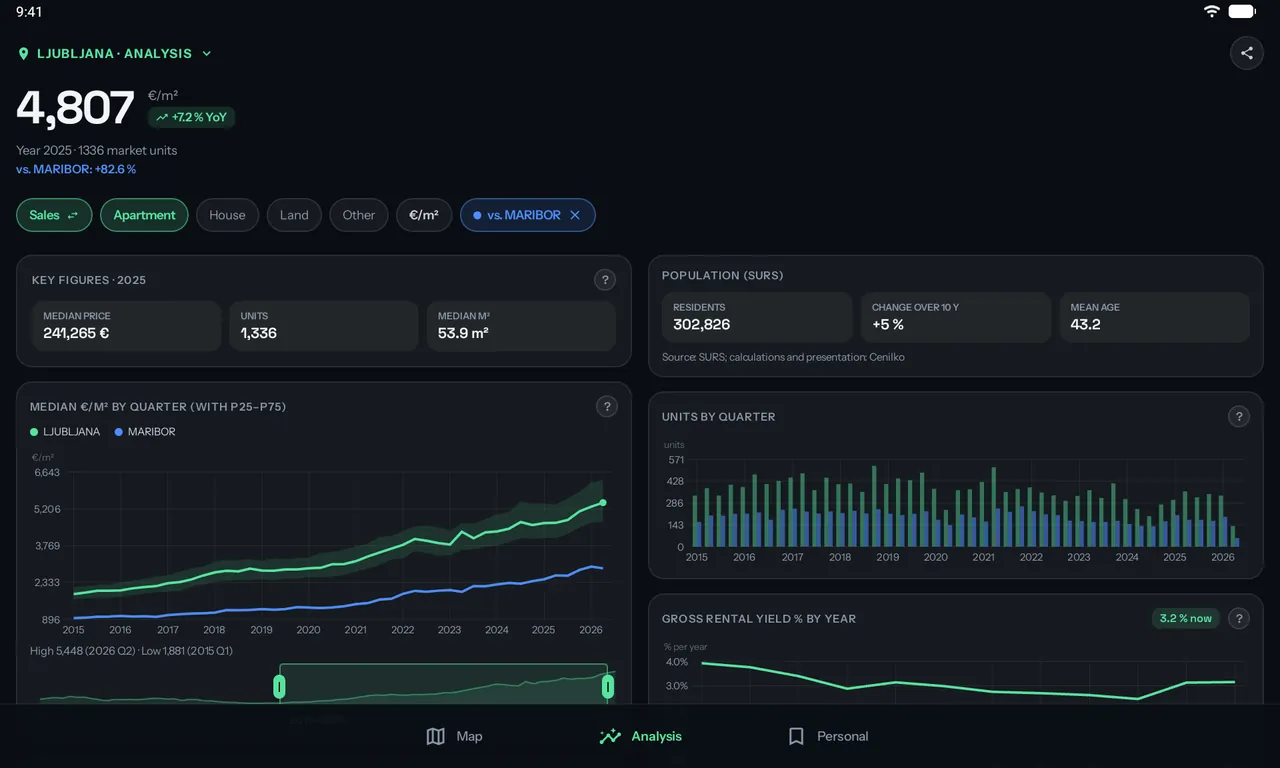
Area analysis, side by side
Median prices, market premiums, a repeat-sales index and local affordability, with two places on the same charts.
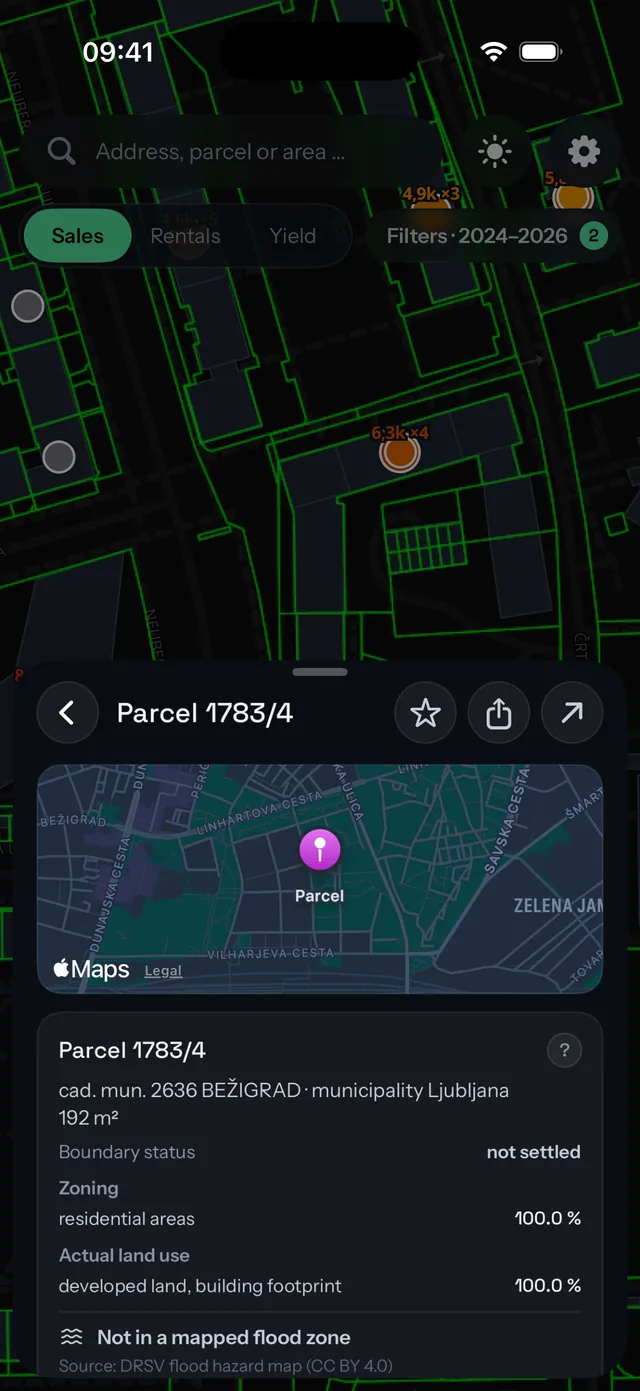
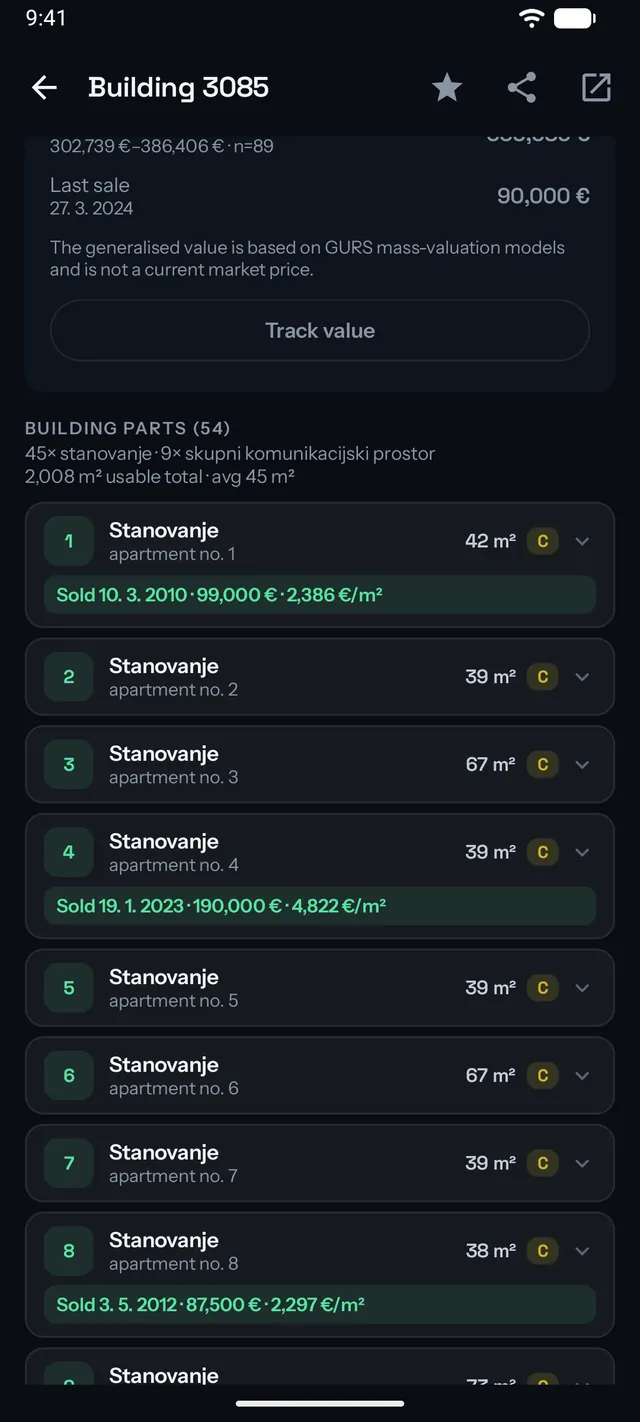
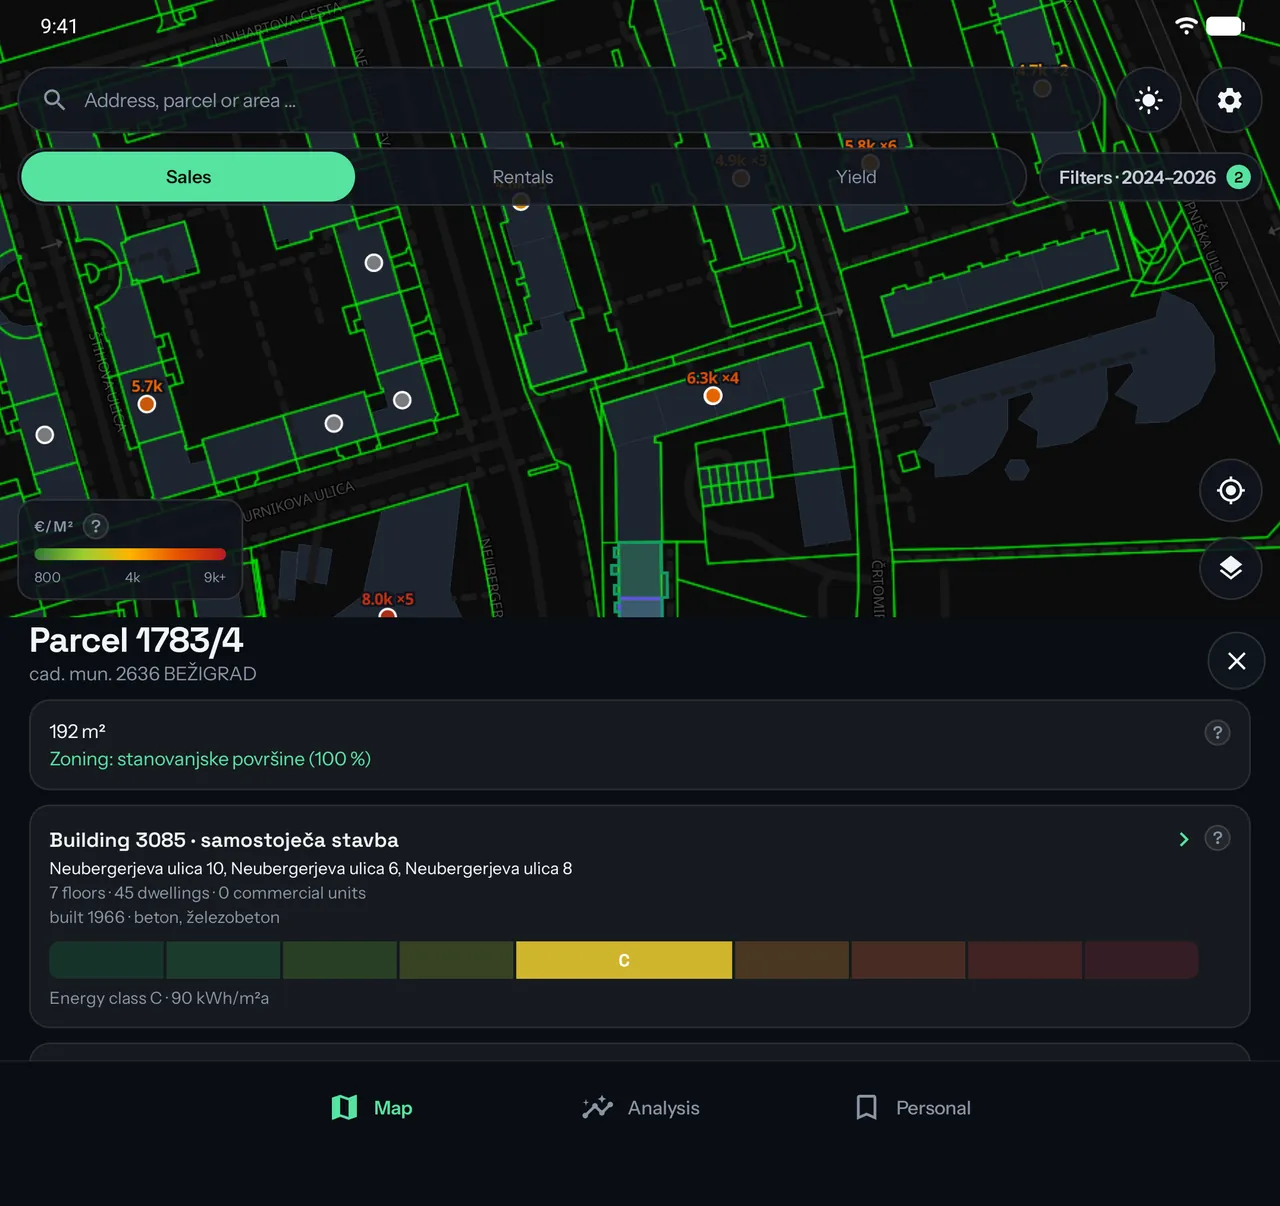
The full parcel, tapped
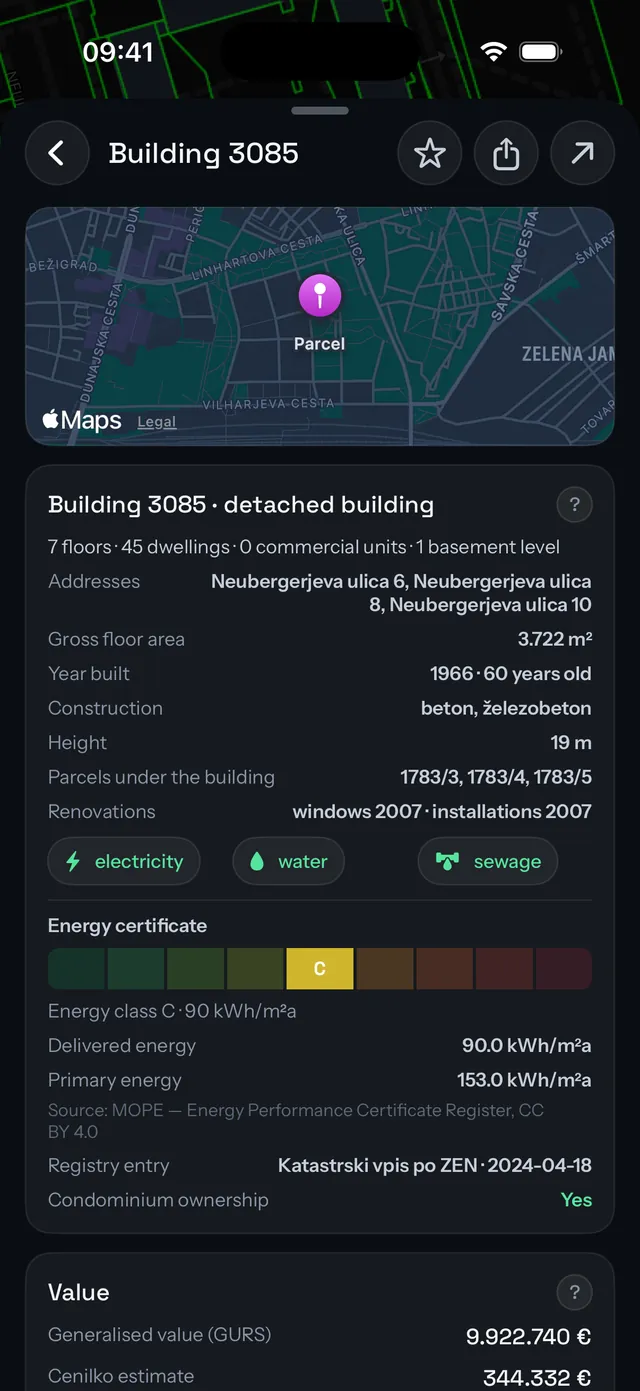
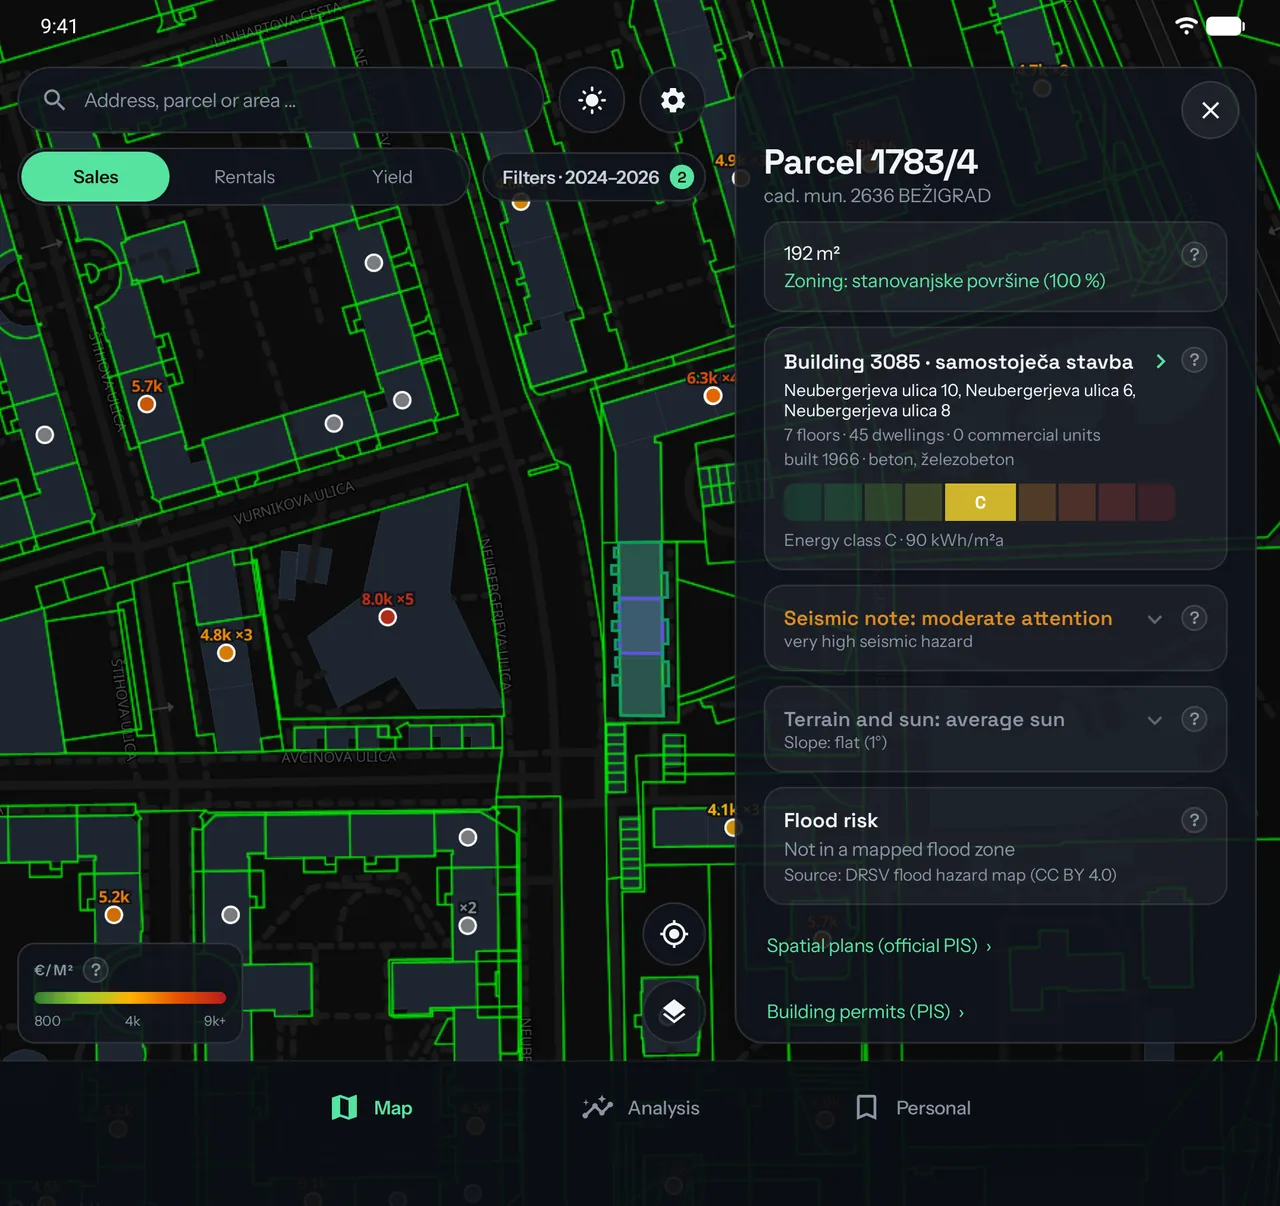
Zoning and actual land use, the building, its units and recorded deals, plus the parcels underneath it.
Risk, at a glance
Seismic, flood and radon attention, heritage and water-protection screening, plus the energy certificate.
Terrain, utilities, demand
Terrain and sunlight, recorded water, sewerage and electricity nearby, and municipality housing indicators from SURS.
Rental yield by area
Gross yearly yield from sale and rent medians, so you can see where renting pays back sooner.
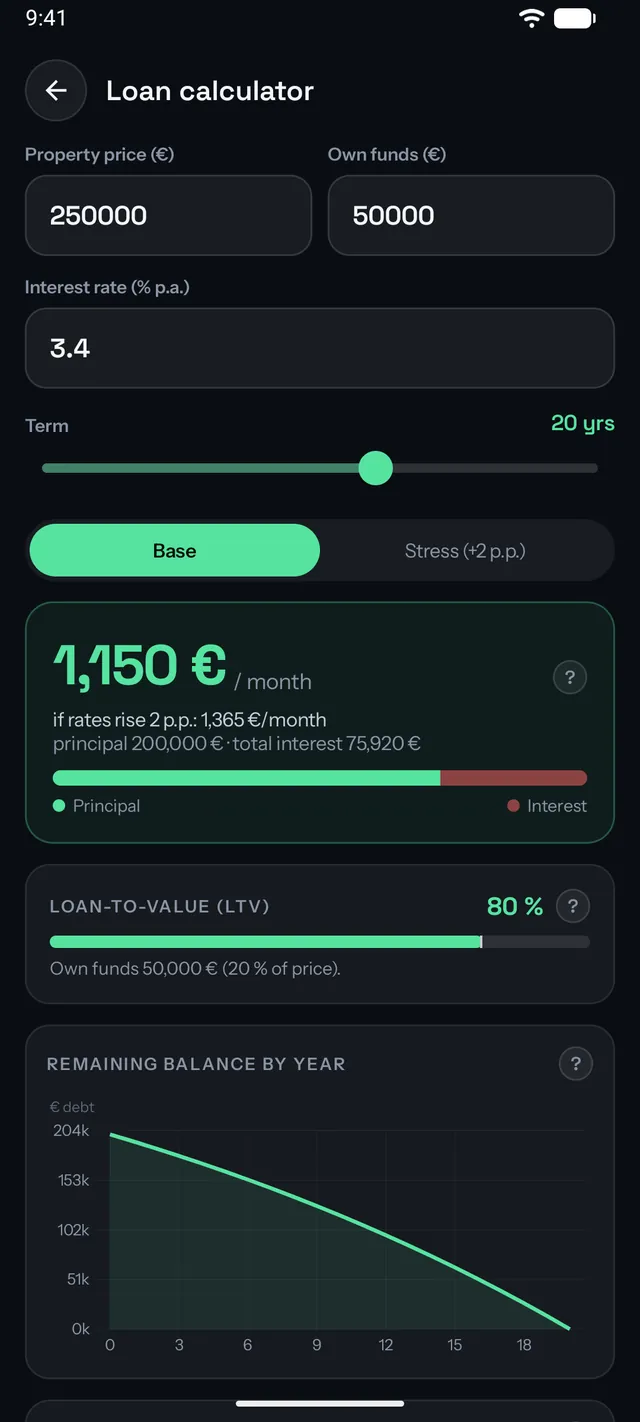
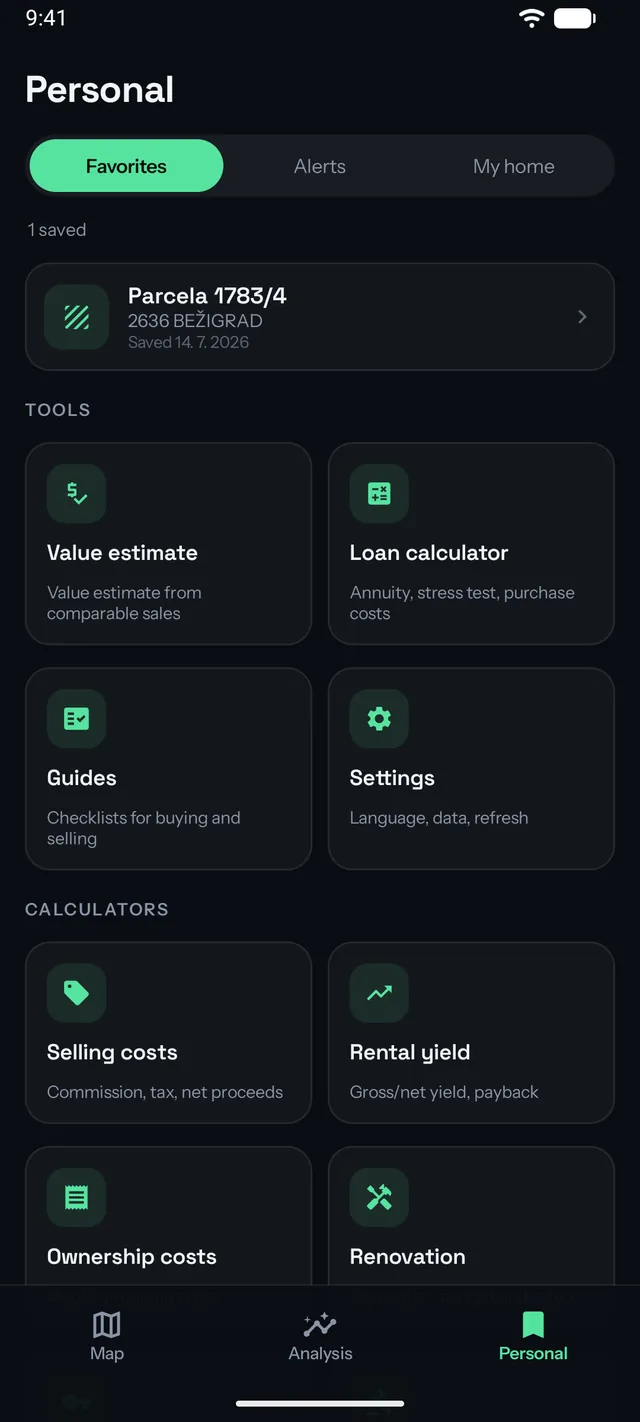
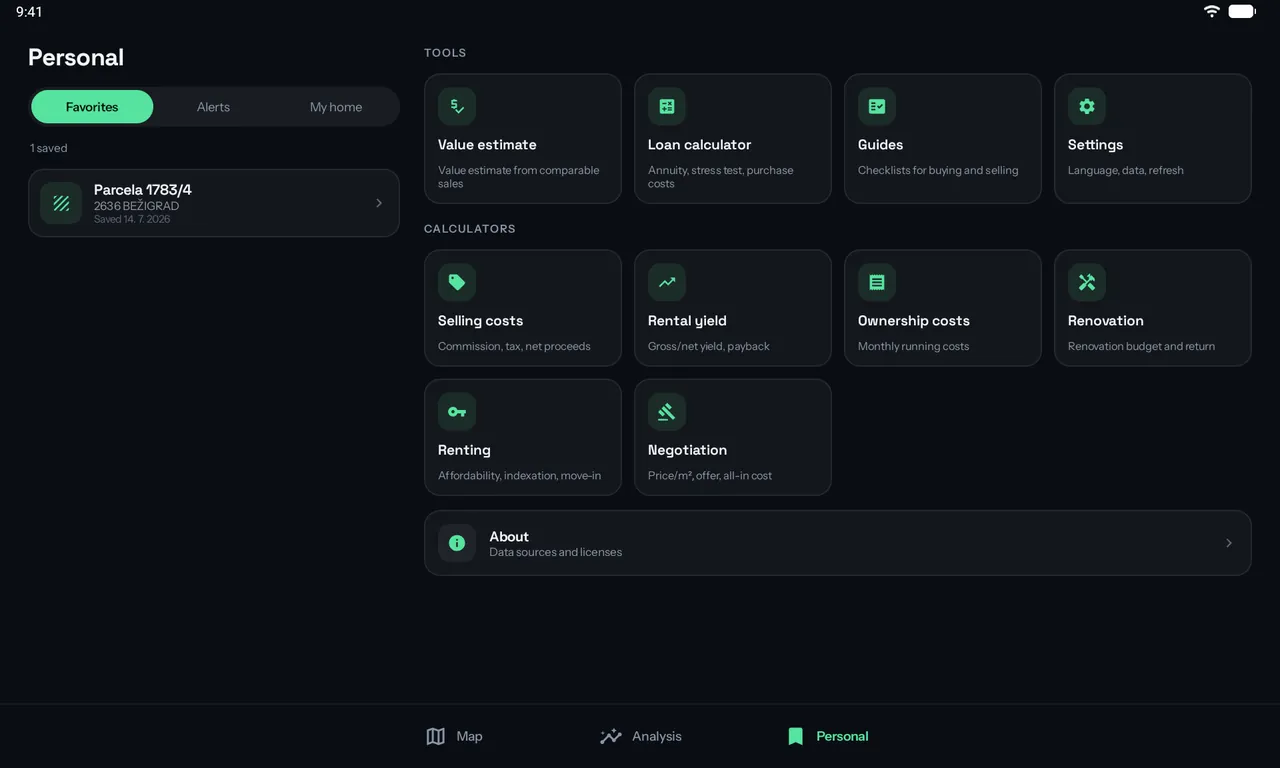
Loan calculator and checklists
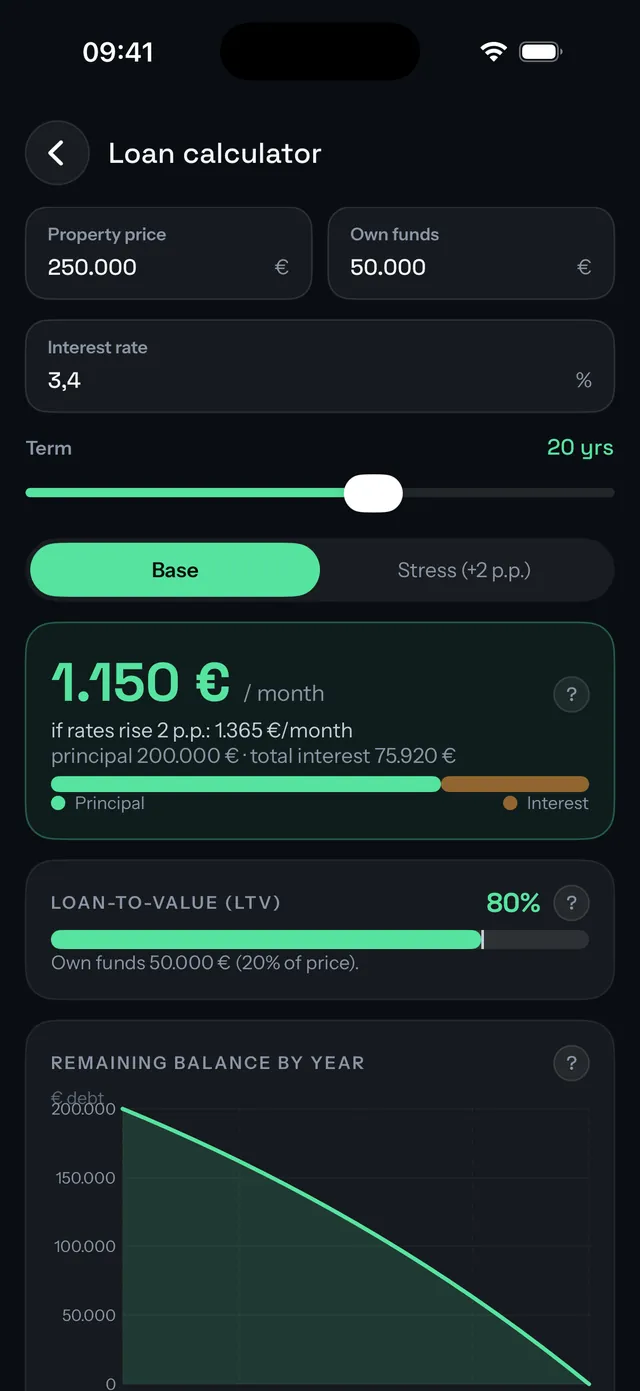
Monthly payment, a rate stress test, loan-to-value and a payoff curve, with buyer and seller checklists alongside.
Deal alerts, on your device
Watch an area or an address and get a heads-up when a new deal is recorded. The check runs locally, with no server.
A report to keep
Save a parcel to your favourites and export a shareable PDF with the numbers that matter.
Not a stretched phone app
On a tablet the bottom bar becomes a side rail and the extra width goes to work. Rotate or resize the window and the layout re-flows to fit. The same applies on iPad.
The layout follows the hinge
Unfold and the inner screen shows map and report side by side. Half-fold it into a tabletop and the map moves above the hinge, details below, so you can prop it on a desk and read hands-free. Fold, unfold or rotate, and everything stays where you left it.
The full desk on iPad
On iPad the map keeps its own half of the screen, the deal list gains a filter sidebar, and the area analysis lays every chart out at once. The screenshots below come from a 13-inch iPad Air.
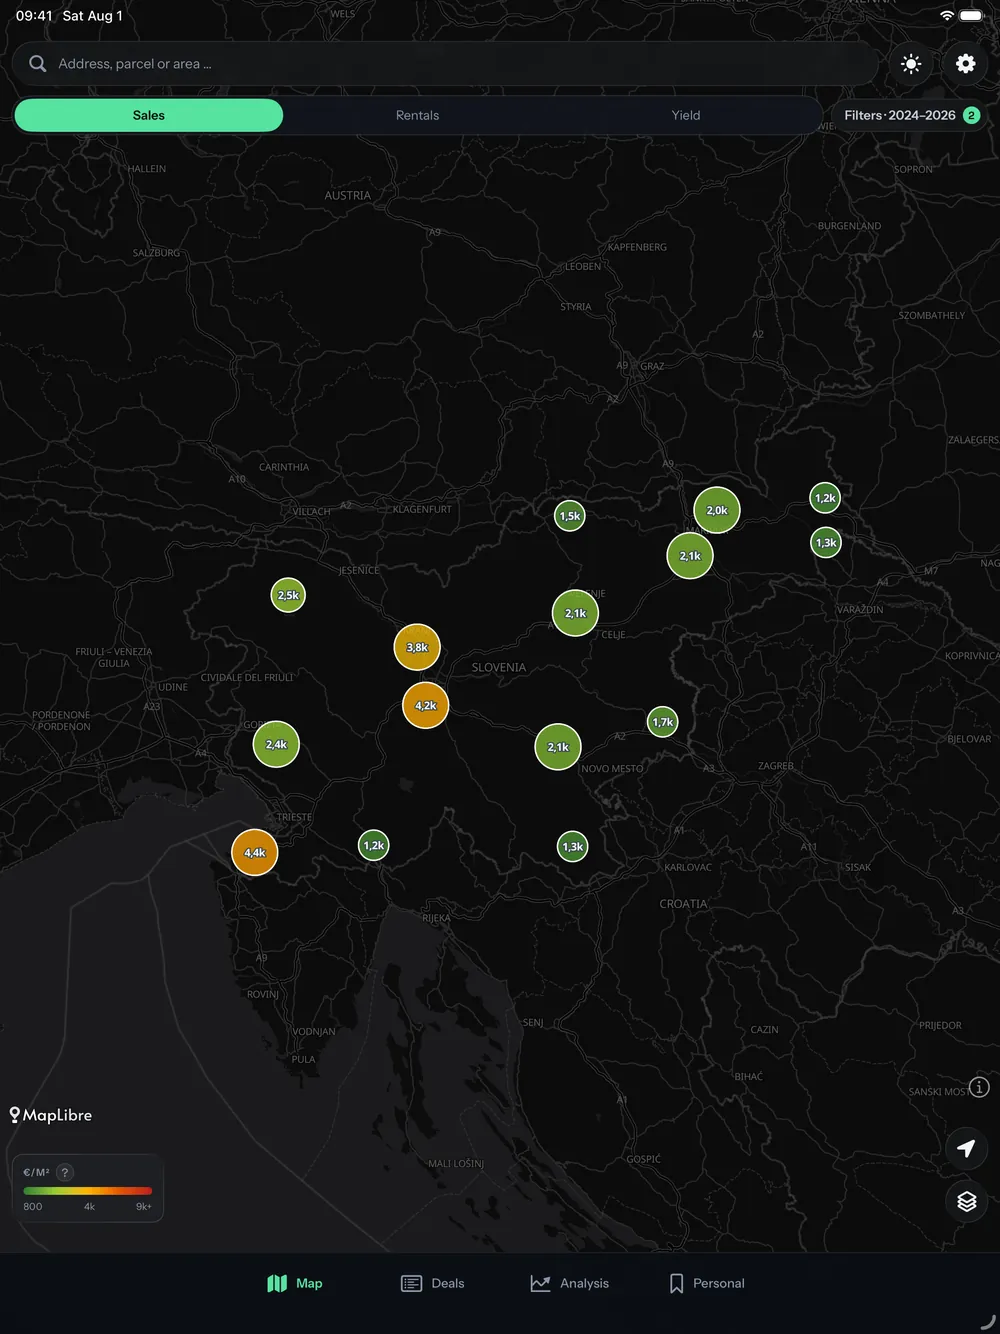
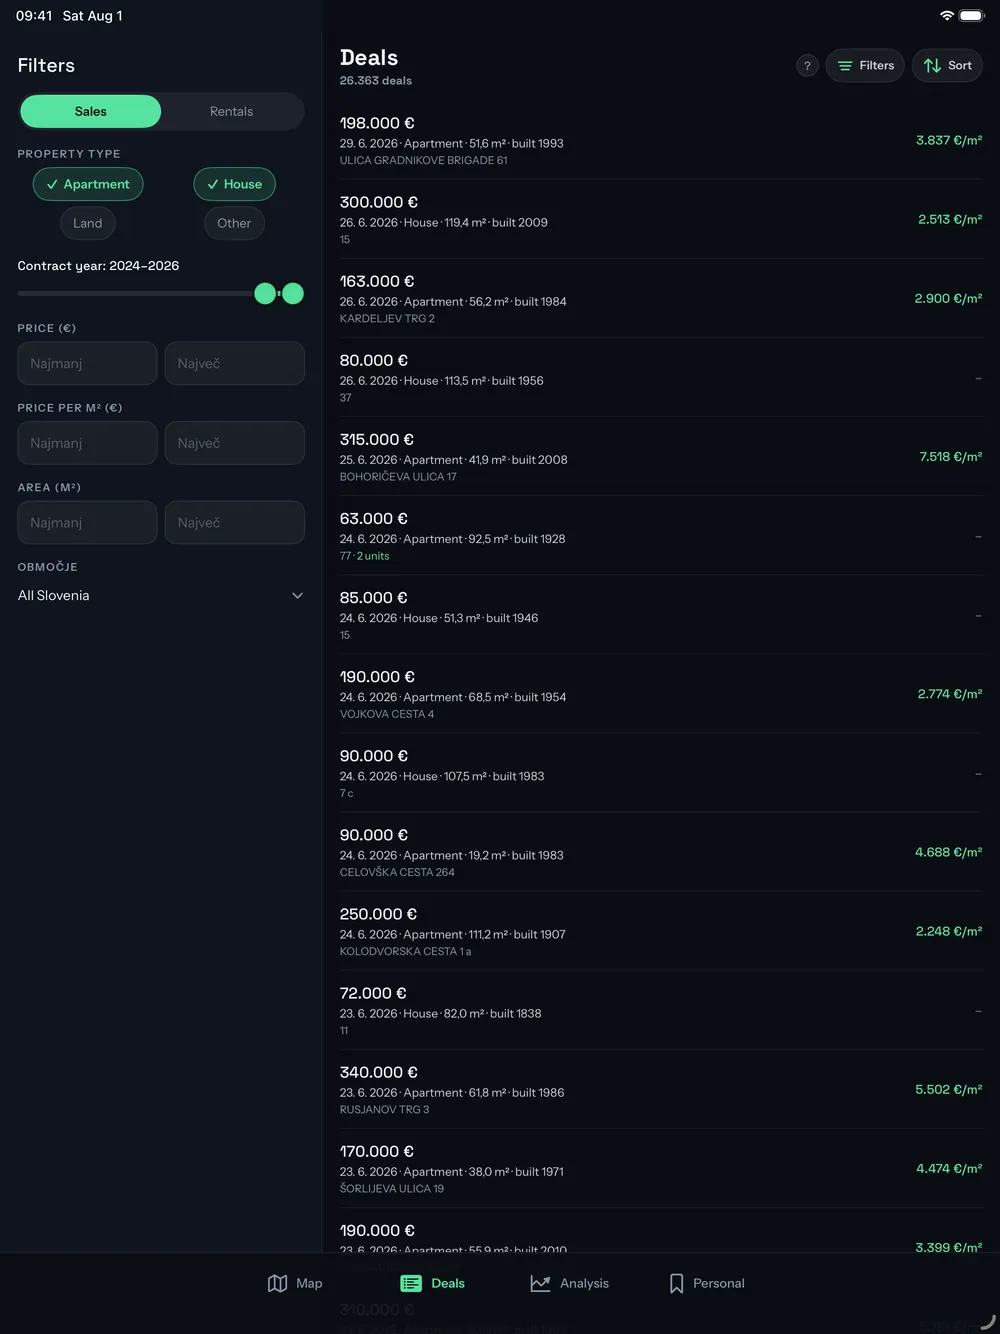
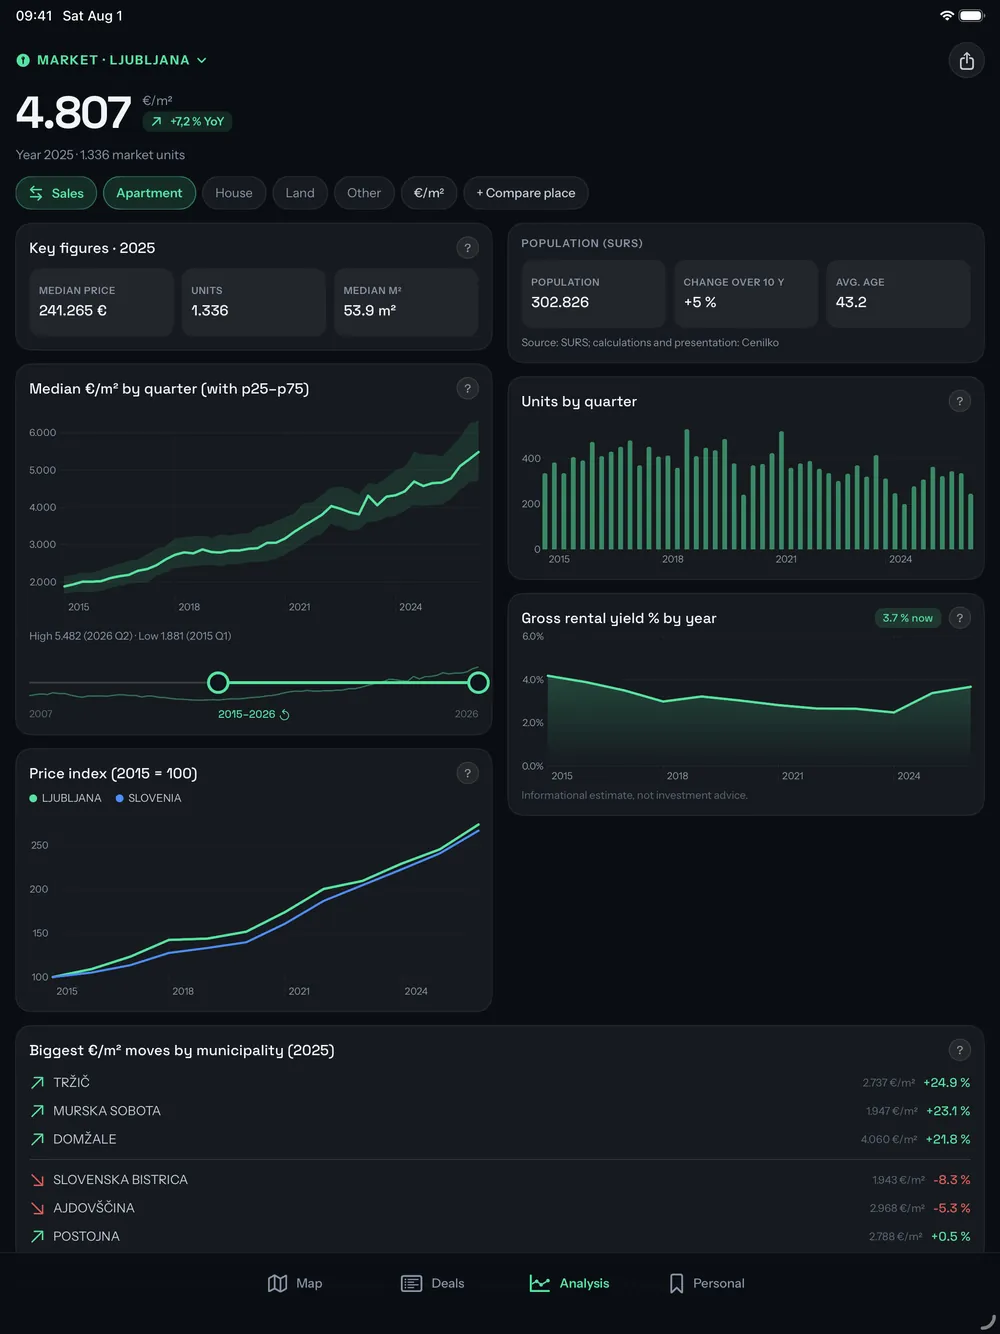
The same registers, natively on iPhone and iPad
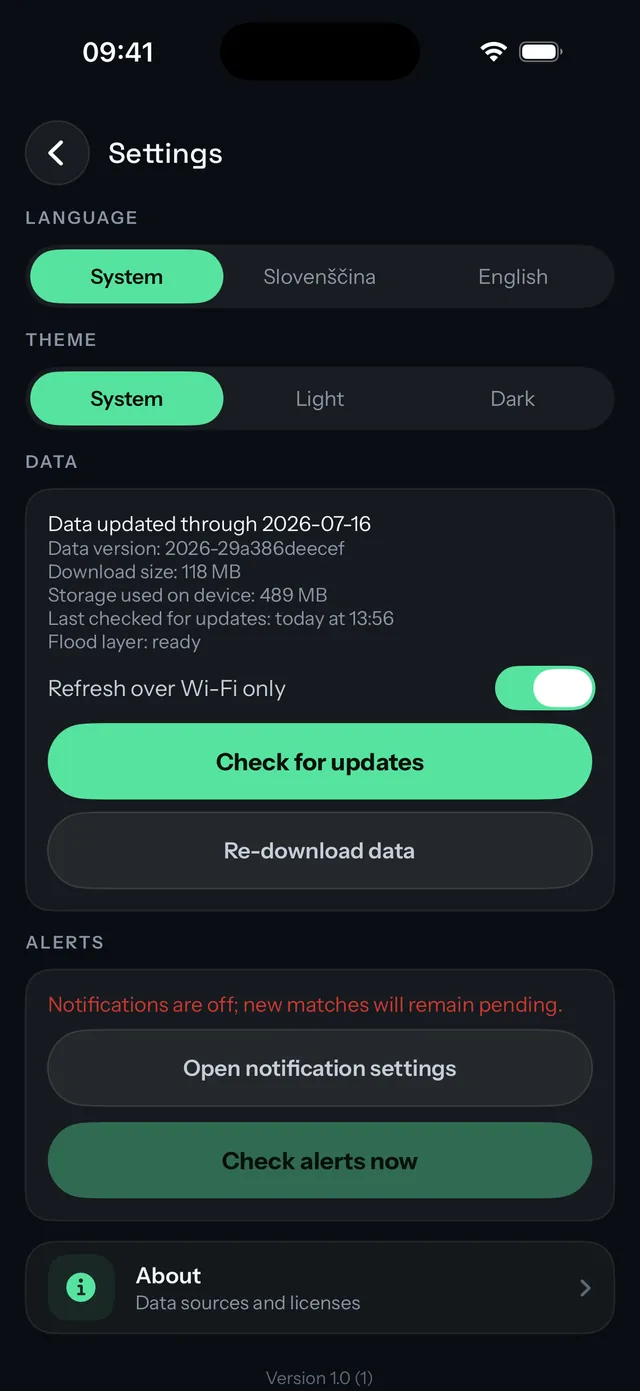
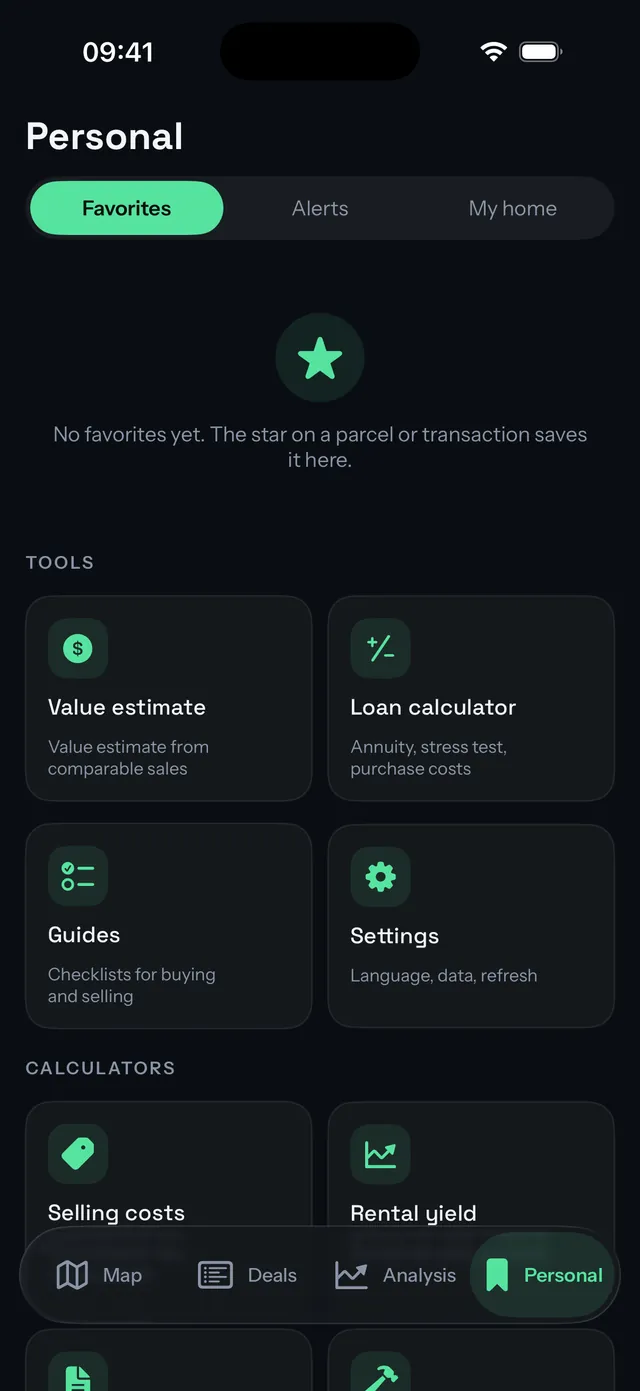
The iOS app is a native SwiftUI build of the same tool: the price map, deal history, value estimates, area analysis, finance tools and the full parcel file, with the same PDF report at the end. On iPad it uses the full width of the screen and rotates freely. The screens above come straight from the iOS build.
Where the numbers come from
Cenilko is built on Slovenia's public registers: the Surveying and Mapping Authority (GURS, for recorded deals, the cadastre, land use and utility networks), the Water Agency (DRSV, for floods and water-protection zones), the Ministry of Culture (eVRD heritage regimes), URSVS and GOV.SI (radon attention), MOPE (energy certificates), EFEHR ESHM20 (seismic hazard), SURS (municipality housing indicators) and OpenStreetMap.
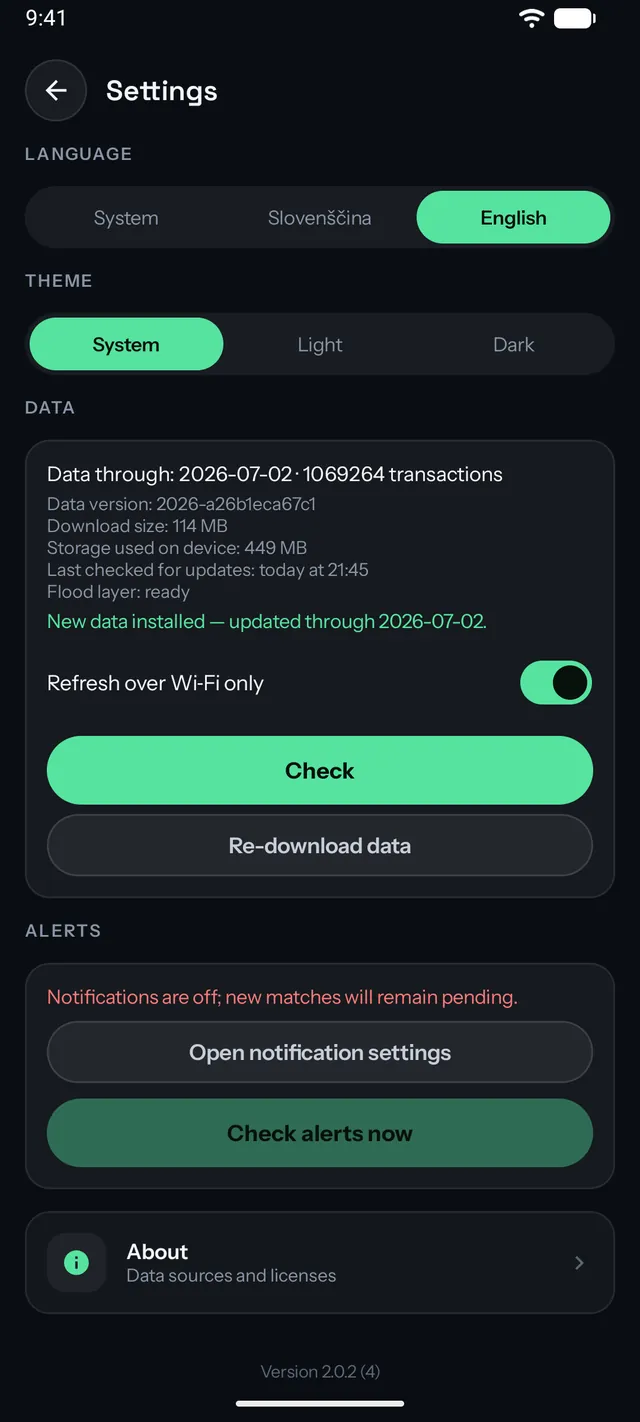
Cenilko cleans, links and aggregates that data, which is what makes a single map and a defensible comparison possible, and also means a figure can differ from the official record. The deals database downloads once, so search, statistics and estimates then run on your device.
Every number is indicative and is not an official valuation. For a legal transaction, check the land register, the cadastre and the tax authority. Read the full Cenilko privacy policy.
Details
- Availability
- Google PlayApp Store
- Coverage
- Every recorded sale and rental in Slovenia since 2007
- Requires
- Android 15 or neweriOS 17 or newer
- Version
- 2.0.31.0
- Languages
- Slovenian · English
- Permissions
- Location and notifications, both optional
- Data
- Public data only, works offline after a one-time download
- Sources
- GURS · DRSV · Ministry of Culture · URSVS · MOPE · EFEHR (ESHM20) · SURS · OpenStreetMap
- Built with
- Kotlin · Jetpack Compose · MapLibreSwift · SwiftUI
Available on Android and iOS.
Explore the property market.
Download Cenilko from Google Play or the App Store.
Get it on Google Play→ Download on the App Store→